So far in 2016 I have had some good luck getting the direction of crude oil correct. On Jan 21, 2016 I suggested that oil was about to rally, then on Feb. 17, 2016 I showed that when a cluster of large rallies in oil happen they seem to occur at major bottoms. Finally, on Mar. 4, 2016 I posted a chart suggesting if $34 was achieved to the upside $41-42 was the target. Now I feel like pushing my luck with a new chart. A more bullish chart.
Thursday, March 17, 2016
Friday, March 4, 2016
Light Truck Sales Strong
Miles traveled are also up to a new record. However, gasoline consumption due to fuel efficiency improvements remain below 2007 levels. This confirms the American love affair with driving is far from over.
Mixed Data - New Orders vs. Construction
Manufacturing New Orders have declined recently.
While Private Construction continues to expand.
DOW - A Resumed Rally? Or Beginning of Recession?
Two conflicting messages come from these charts. The above chart has the DOW still above a long term channel. The below chart shows the IPO revenue and numbers of issued is declining like in previous recessionary periods. If the DOW breaks the support it would confirm the IPO message.
Inflation Metrics
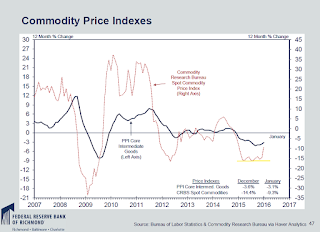
All measures of inflation are firming from a low level in the US. If commodity prices stabilize and wage growth continues to show strength, then the FED will be much more comfortable raising rates.
Subscribe to:
Comments (Atom)


