Saturday, November 26, 2016
Sunday, October 16, 2016
US Trade Deficits and Recession
One burden of having the reserve currency is that the nation who issues it has to be the consumer to the world. Often the reserve currency is referred to as a privilege, however, Michael Pettis in Foreign Affairs explained back in 2011 that it could be a burden as well.
Note how shrinking trade deficits in the US have coincided with US recessions. This means the US has to buy more from the world than it sells and that cutting off global trade will not bring back workers.

Note how shrinking trade deficits in the US have coincided with US recessions. This means the US has to buy more from the world than it sells and that cutting off global trade will not bring back workers.


Monetary Velocity
No bottom in sight?
 Or is it bottoming?
 When velocity bottoms, deflationary trends will become non-existent.


US Dollar Bull or Bear?
Over the past 5 presidents Democrats have been US Dollar bullish while Republicans have been USD bearish.

Is this chart about to break out or break down?

Demographics
There is concern by some analysts that demographics for equity assets are negative as the baby boomers retire. However, according to the Pew Center the millennials are a larger group.


Bubble?
Will this end badly? Probably and when it does, will the PhD bubble be over? Will it be the end of interventionary economics? Is it the end of market socialism?


Global PMI Trend Line Broken to Upside?
Will this continue? I believe that now that the IMF has lowered their outlook for global growth, that global growth should increase.


Sunday, October 2, 2016
Fuel for the next Oil boom
When China began consuming a lot of gasoline as their automobile ownership took off, China was producing 4.5MM barrels of oil/day. India only produces about 1.5MMbbl/day. If Indian demand follows the path of other rapidly industrializing Asian nations, their imports will be larger than China.
In a few years, assuming India continues to grow, all the cancelled projects will cause a shortage. It is one reason I find it hard to be bearish of oil prices.

In a few years, assuming India continues to grow, all the cancelled projects will cause a shortage. It is one reason I find it hard to be bearish of oil prices.

China Stockpiling Oil...Why?
When Brent futures dro below $45, China has been increasing oil imports. Why is China stockpiling so much?


Saturday, September 17, 2016
Buy the Loonie?
This should bode well


Seems like a contrarian idea. Canada has a housing bubble in certain cities. Oil prices are hurting three of ten provinces. Debt is expanding and economic growth has been weak. Yet the Economist Big Mac Index and the CFR Mini-Mac Index has the CAD (or Loonie) as undervalued against the USD.
The Economist Big Mac Index has the CAD undervalued by 10% and the CFR Mini-Mac Index by 20%. Strong commodity flows could be forecasting a rally.
Honestly I hate the idea so much I think the trade will probably work.
2017 Recession?
There is no clear signal for a 2017 recession as of yet. There are some warning signs, such as a potential peak in light truck sales, but recessions have a weird habit of happening around Presidential elections. This year with the dislike of both candidates its possible Americans talk themselves into a recession.


Atlanta Fed Sticky CPI
The Atlanta Fed publishes what they refer to as the stick price consumer price index. It is described as:

"The Atlanta Fed's sticky price consumer price index (CPI)—a weighted basket of items that change price relatively slowly"

This metric does not look deflationary and is near its post financial crisis high. My gut feeling is that most consumer spending is more like this metric than the chain weighted CPI.
Monday, September 5, 2016
US Economy, Recessions and one of my Favourite Indicators
I believe light truck sales is one of the best economic indicators. Few people buy pick up trucks because they want one, most are bought for work and those that do usually work in blue collar jobs and if they have the funds to purchase a new truck the economy is doing well.


Other than the double dip recession of the early 1980's, light truck sales peaks out at least 1 year before a recession. Now this indicator is not a timing model, as in when it peaks sell everything and buy canned food and ammo, but when the sales peak followed by the trend line being broken, historically it is a good idea to begin to watch the economy for other indicators.
Are truck sales peaking?
The Re-emergence of the Peak Oil Argument and the Emergence of a Free Market in Oil
The Peak Oil argument refuses to die. Today it has morphed into the Peak Conventional Oil argument. There are parts of the argument I agree with such as any finite resource will eventually run out, either due to regulation or over production, however, this is not what is happening right now.
Humans are pessimistic for anthropological reasons. Life has been hard. Pessimism is even believed to be genetic, however, explaining the current woes of the oil industry by using the Peak Oil argument fails Occam's Razor. There is a simpler explanation found in economics 101, the adjustment of an oligopoly dominated market to a free market.

In a free market the quantity produced would be Qc and price Pc and in an oligopoly the price would be Po and quantity Qo. If the price is managed the perfect amount above the marginal cost curve it deters new entrants, but should demand expand too quickly and prices rise fast enough there is an incentive for new entrants to enter the market.
This is what happened between 2000-2011. The demand from emerging markets expanded faster than the oligopoly could increase production, leading to prices that rose far enough above the marginal cost of production enticing new entrants to the market. This was coupled with a technology advancement in gas production (no oligopoly and no managed price leading to greater incentives to adopt technology and not just free ride on cartel prices) which was transferred to the oil side of the energy sector and reduce costs on what had previously uneconomic sources of oil.

To attempt to regain control of the market the oligopoly flooded the market to eliminate the high cost producers. However, by doing this the dominant oligopoly producer had to act as a monopoly producer and destroyed the cartel partners. While this was going on the new entrants and the free riders from the oligopoly produced market began to reduce costs and threaten monopoly producers ability to return to a managed market. What is happening is the emergence of a free market in oil.
Below is my response to an article entitled "The Oil Industry Faces a Grim Future?"
I disagree. I believe this analysis is incorrect.
What happens to a market when prices are held above the long run inflation adjusted cost for extended period of time? You get surpluses. What happens when you get surpluses? Prices decline. What happens when you get price declines? Inefficient companies (and in this case countries) go bankrupt. This is all economics 101.
Prices are not low, they are within on standard deviation of the long run inflation adjusted prices per barrel. The 2006-2011 prices were historically high on an inflation adjusted basis.
The long run mean inflation adjusted price of a barrel of oil from 1946 (Post war period) in 2015 dollars is $41/barrel, since 1980 it is $51. The price is barely below the mean of the last 36 years and above the mean for the past 70 years. This mean is also biased to the upside due to cartel behavior. A free market, like the one that is developing would have had a lower inflation adjusted price.
The low price narrative that is continually being repeated is to disguise poor capital allocation decisions, the inability to control costs and the reluctance to adopt technology.
Currently what is happening is that producers who were able to free ride on inefficient and cartel behavior are being forced to adjust a free market in oil. In a few years costs will be lower for those that survive and those that cannot reduce costs they will disappear.
The energy business has historically been slow to adopt new technology and methods. This forced adjustment to a free market will accelerate the adoption of technology. Directional drilling was first used in the 1930s but only adopted in 2000s and wells have been fracked since the 1940s, the AAPG released a paper in the 1950s discussing the first 10 years of this practice. It took 70 years to combine the two. No other industry would survive adopting technology and change this slow. The only reason why is 100 years of oligopoly (Texas Railroad Commission followed by OPEC).
Because prices were held above the marginal cost of production due to the cartel effect producers were to free ride and be inefficient. This is essentially no different than what the automakers had to adjust to when the Japanese gained market share in the 1980s. But to claim costs are low is incorrect and forecast dire straits ad infinitum bears the semblance of the predictions of the end of the US automakers in 1980.
Further using the peak oil declining EROEI argument also ignores history. When Col. Drake drilled the first well into a “conventional” reservoir in the 1860s the EREOI was very low, maybe negative. However, over time the EREOI improved. To compare “unconventional” production or oil sands today versus conventional wells in Saudi Arabia that have had continual, but slow technology improvements over the past 70 years is to assume that the EREOI is static and not dynamic. EREOI for oil sands has improved since the 1950s, and unconventional EREOI has improved just in the past 5 years. Unless you can tell me what the return on energy will be for a SAGD project when they begin using microwaves to reduce bitumen viscosity and eliminate the need for natural gas, then the EREOI argument is a strawman. It is like comparing baseball players of today versus the 1890s, fun over a drink but a waste of time.
Some historical perspective is required in analysis. The issue is not that prices are low, poor capital decisions were made when prices were historically high. The world is not ending. The sector is fine. All that is happening is the normal transition from a cartel dominated oligopoly priced market to a free market. Its economics 101.
Charts of the inflation adjusted price of a barrel of crude oil http://inflationdata.com/Inflation/Inflation_Rate/Historical_Oil_Prices_Chart.asp
http://www.macrotrends.net/1369/crude-oil-price-history-chart
Sunday, September 4, 2016
Spare Capacity vs. Above Ground Storage
A lot has been made about the large above ground oil inventories. The EIA publishes an update on this weekly. As you can see the above ground storage is well above the 5 year range.


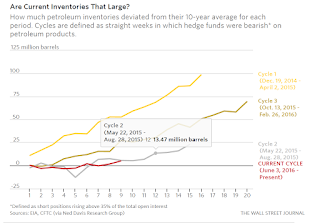

However, spare capacity (or below ground storage) has been shrinking.

Further this Wall Street Journal article suggests that the inventory levels are not abnormal for this point in the cycle.

Maybe the market is tighter than people realize?
WTI Commitment of Traders Report
There seems to be an interesting development on the WTI COT report. You have producers increasing their longs while open interest is increasing.
Not sure what it means but some producers could be buying their hedges back.

Not sure what it means but some producers could be buying their hedges back.

Wednesday, August 31, 2016
China's Manipulated Currency
Some accuse China of manipulating their currency lower to increase exports. The below chart is from Horizon Exchange Traded Funds during a presentation (replay and pdf - links may no longer work) they made for their Global Currency Opportunities ETF.
It sure does not look manipulated lower versus the Canadian Dollar.

It sure does not look manipulated lower versus the Canadian Dollar.

Thursday, August 18, 2016
The Real Reason Energy Companies Have Been Going Bankrupt
The reason oil companies have gone bankrupt over the past few years is not due to "historically low oil and natural gas prices" as stated in this article.
Here is a long term inflation adjusted price chart:


The real reason energy companies are going bankrupt is more technical.
Reserve base lending for unconventional reservoir projects became a ponzi scheme. This is how it works.
Step 1) An oil company borrows money or issues equity to drill a well.
Step 2) The well "discovers" oil. The reason I put discover in quotations is that the resource (not reserve, there is a difference) potential of shale source rocks has been known for decades.
Step 3) Estimate the resource and reserve potential.
NB: Resource is properly defined as uneconomic at the current price.
Reserve is properly defined as economic at the current price.
Step 4) Book the reserve as an asset on the balance sheet as per SEC legislation.
Step 5) Borrow money against the reserve.
Step 6) Drill more wells and book more reserves and borrow more money.
Step 7) Repeat until you cannot repeat again.
This process was not always a ponzi scheme. Before the mantra of peak oil and the fear the world as running out of oil this practice was done conservatively. But when the idea that world was short of crude supply the thinking became that oil was a one way trade. This gave Wall Street the confidence that lending money against high cost reserves to develop more high cost reserves was a sound practice. On the other side of the transaction little thought by producers was given to the scenarios that would cause these reserves revert to resources and be treated differently on their balance sheet.
Furthering the Ponzi scheme was Central Bank policies of zero percent interest rates. This cheap source of funds decreased the discount rates for cash flow streams, increasing the net present value and distorting the time value of money calculation for these type of projects.
Under this strategy developing more reserves meant more debt. When prices reverted to the mean, reserves became resources and these companies became insolvent as resources are not the same quality asset as reserves and are treated differently under SEC legislation.
Exacerbating the problem was now these producers have to maximize cash flow to cover the interest cost which creates more excess supply and more downward pressure on prices turning more reserves back into resources impairing more balance sheets and strengthening the negative feedback loop.
The bankruptcies happening today are the result of historically high oil prices, a this time is different type thinking and central bank distortions, but not low prices.
Here is a long term inflation adjusted price chart:

Does the current price look historically low on an inflation adjusted basis?
Here is the chart not adjusted for inflation.

Natural Gas prices are closer to the lower end of the price range. Below is the inflation adjusted long term natural gas price.

However, for as far back as the above data goes the price of natural gas is regularly between $2-4/mcf. This is the natural range. The higher prices have all been "spikes" due to hurricanes, La Nina events or other short term phenomenon.
Here is the non-adjusted price chart. As you can see these are not historically low prices.

It appears the 2006-2011 period for oil and natural gas were HISTORICALLY HIGH prices. The opposite of what the article states.
Reserve base lending for unconventional reservoir projects became a ponzi scheme. This is how it works.
Step 1) An oil company borrows money or issues equity to drill a well.
Step 2) The well "discovers" oil. The reason I put discover in quotations is that the resource (not reserve, there is a difference) potential of shale source rocks has been known for decades.
Step 3) Estimate the resource and reserve potential.
NB: Resource is properly defined as uneconomic at the current price.
Reserve is properly defined as economic at the current price.
Step 4) Book the reserve as an asset on the balance sheet as per SEC legislation.
Step 5) Borrow money against the reserve.
Step 6) Drill more wells and book more reserves and borrow more money.
Step 7) Repeat until you cannot repeat again.
This process was not always a ponzi scheme. Before the mantra of peak oil and the fear the world as running out of oil this practice was done conservatively. But when the idea that world was short of crude supply the thinking became that oil was a one way trade. This gave Wall Street the confidence that lending money against high cost reserves to develop more high cost reserves was a sound practice. On the other side of the transaction little thought by producers was given to the scenarios that would cause these reserves revert to resources and be treated differently on their balance sheet.
Furthering the Ponzi scheme was Central Bank policies of zero percent interest rates. This cheap source of funds decreased the discount rates for cash flow streams, increasing the net present value and distorting the time value of money calculation for these type of projects.
Under this strategy developing more reserves meant more debt. When prices reverted to the mean, reserves became resources and these companies became insolvent as resources are not the same quality asset as reserves and are treated differently under SEC legislation.
Exacerbating the problem was now these producers have to maximize cash flow to cover the interest cost which creates more excess supply and more downward pressure on prices turning more reserves back into resources impairing more balance sheets and strengthening the negative feedback loop.
The bankruptcies happening today are the result of historically high oil prices, a this time is different type thinking and central bank distortions, but not low prices.
Monday, August 8, 2016
Q3 Newsletter
Until the new site is built you can find the Q3/2016 and all previous newsletters here.
Thursday, August 4, 2016
Commodity Index
The CRB All Commodity Index has not broken its downtrend but has based higher than pre-Great Recession. A higher bas would mean the next boom will break the old high, or that the "Super Cycle" has more to deflate. However, with all the talk of deflation around the world I find it interesting that commodities are not at new lows.


US Economic Growth
A theme I have been working with for awhile is the economy is not that bad. If you ask a major bear about what the perfect economy is and what would it take for them to be less bearish or even bullish they cannot answer. Some people are just always negative. Growth has been revised up, it may be revised down, but the recession has not started. It may start in the first year of the next President as recessions tend to happen in first years, but not always.


Wednesday, August 3, 2016


US Economic Update

Truck sales still in an uptrend, yet testing the trend line from the recession low.

Manufacturing expanding after a false breakdown.

Services doing well.

Expenditures and Disposable Income growing.

Hours worked keeps on rising. The US economy may not be growing at rate that is acceptable to the media and those obsessed with growth numbers. But maybe the law of large numbers is in play here. The larger the US economy gets the more net GDP is created by a smaller growth figure. If you have 2% growth with a $17 trillion economy you generate $340 billion in GDP which would require a 34% growth rate for a $1 trillion economy to add $340 billion. Maybe we are obsessed with growth rates?
Toronto Stock Exchange Outperforming US Indices
With no growth in Canada, in fact negative growth at periods, why would the TSX be outperforming the US indices? If you have read a number of my previous posts I think you might be able to guess my reasoning.


Tuesday, August 2, 2016
All Commodities Rallying

The government numbers do not show much inflation. There is not a supply deficit for most of these metals, so why are they all rallying? War? Forecasting inflation? Bored traders?
Oil Chart and Seasonality and the Next Supply to Disappear
I have been posting a lot on oil lately here, here, here, here, here, here, here, here and here (not necessarily in order) over the last month or so. Crude oil has been a big part of my career. One reason I am still bullish on crude, besides all the other posts is that I do not believe the news leads the market but the market leads the news. This bad news is all hindsight. Below is the weekly chart.


The chart could be putting in an inverse head and shoulders pattern (could is the key word) that would match up with the other bottoms and EWT target in previous charts. The second chart is of crude oil seasonality.

Crude oil historically tends to bottom in late July (could early August this time) after having a weak June and sell off in July.
Finally, Rystad put out this chart discussing decline rates. OPEC produces about 1/3 of the global liquid hydrocarbons or 32MMbbls/d leaving about 63MMbbl to non-OPEC producers. A 7% decline rate means that approximately 4.4MMbbl/d of production is lost each year. OPEC's fields decline too, but that data is not readily published so it is fair to estimate the world loses 5+MMbbl/d each year. Add in uneconomic production due to the current price range, and it is easy to see where the next drop in supply will come from.

Friday, July 29, 2016
Elliot Wave Count - Oil
As a geologist and former investment advisor as well as corporate finance associate for a Canadian investment house that financed resource exploration I have a big interest and fascination with the commodities market. In a few previous posts I have discussed the Elliott Wave count for oil, here (my count) and here (someone elses count). It appears I have the count wrong or that the retracement of Wave 2 is larger and it re-traces 0.618 of the Wave 1 rally.
Here is my new chart. If correct we are close to completing Wave C of the correction with in Wave 2 of the main trend. Or I am just complete wrong.

Here is my new chart. If correct we are close to completing Wave C of the correction with in Wave 2 of the main trend. Or I am just complete wrong.

Crude Oil - Where is the Bottom?
I had expected the bottom to be in the $41-42 range as stated here, here, here and here and the next few days will determine if I am wrong or lucky. However, I want to post a chart from a newsletter I read that was posted back in January that has appeared to be quite accurate so far. His target is $38.43 back and a bottom in late August. To his credit he also had the bottom in February at around $30 and a peak in June at about $50.


Now compare that with the actual chart.

So if the January forecast continues to be correct, a bottom in the high $30's will form over the next few weeks and a rally into the $60s with a peak in November.
If that is the case we are close to a bottom. Only time will tell.
Subscribe to:
Posts (Atom)