Monday, February 22, 2016

Oil and Stock Prices

Ben Bernanke posted this interesting chart in his discussion on the correlation between oil and stock prices recently. Using James Hamilton's, oil price model he suggests that the oversupply of production should have only caused oil to decline to about $70/bbl.
Oil Inventory Seasonality

Currently the inventory build is following regular seasonal patterns (at higher levels of course) and if this is the case late March to early April we should start to see a decline.
Friday, February 19, 2016


Wednesday, February 17, 2016
S&P500 Underperforms when Employment is Below 5%
A few posts back, I wondered whether wage increases will increase the participation rate? - one better hope so if they are a stock investor.


Crude Oil and Large Rallies

After seeing the above chart, I decided to post the rallies on the WTIC daily price chart.

Clusters of rallies have been rewarded.
Wednesday, February 10, 2016
USD/WTIC Ratio - Update


The Head and Shoulders pattern identified in a previous post did break down, but rebounded quite quickly to the top Bollinger Band (which is one standard deviation above the mean price). However, the Weekly Chart is getting overbought.
Some Inflation Charts...Firming from a Low Level
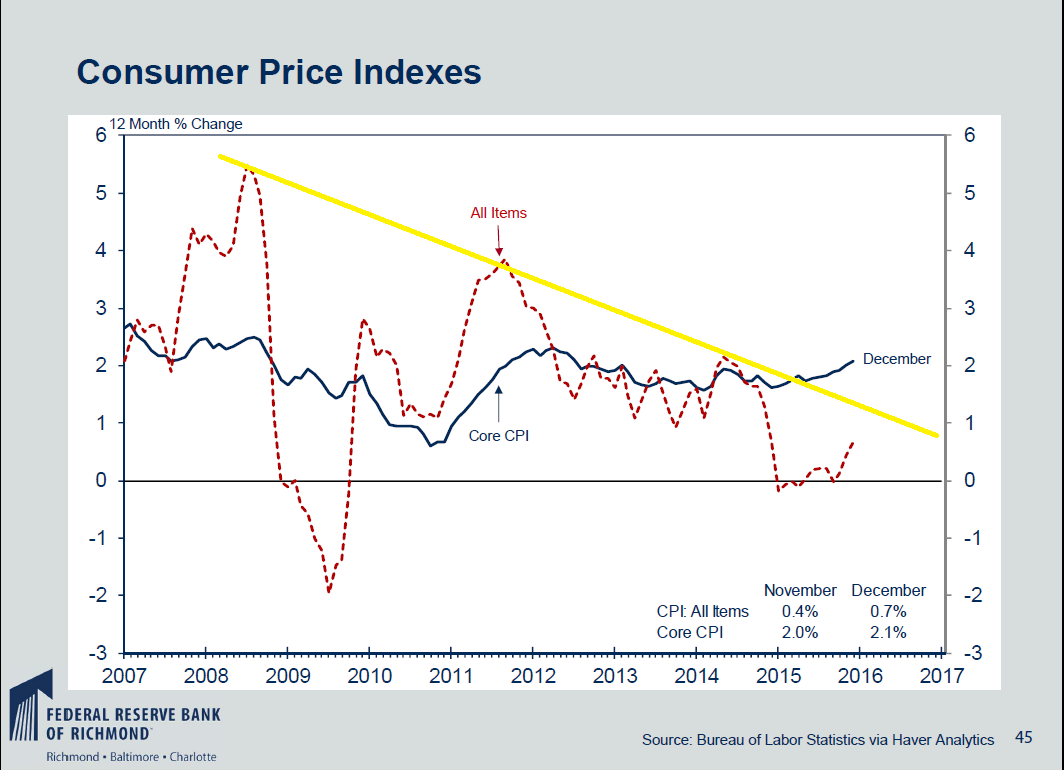


There certainly is no need to fear inflation, however, these metrics are firming at a low level.

Are Wage Increases Attracting Workers Back to the Labour Market?


Are wage increases finally attracting people back to the labour market? If these entrants are absorbed and wage increases are contained, this would be huge sign the US economy is doing better than expected
Truck Sales

Light truck sales remain in an uptrend. Light trucks sales tend to fall off 6 months or more before a US recession. Growth may be weaker than expected, but it is not recessionary.
I thought the Phillips Curve was Dead


Chinese GDP Growth and Gross Expansion

Chinese gross GDP expansion is as much at 6.8% (2015) with its larger economy than it was at 12.7% with its smaller economy (back in 2006) and at 9.6% (in 2008). Our obsession with growth rates obscures the fact that the Chinese economy is still expanding by quite a much.
India vs. China

Will India grow with out increasing manufacturing? Does this mean India will move right to a service and import economy?
Oil Prices, Euro and Inventories

This scatter-plot created by Confluence Investment Management shows where oil prices have traded with different inventory levels and Euro prices. One the big head winds for oil prices has been the US dollar. There has a been a slight bid in the Euro and I think it could be the contrarian trade of the year. Will this give oil a bounce?
Subscribe to:
Posts (Atom)